Mentors
- Prajna N Hebbar
- Harshvardhan R
Members
- Nishant N Nayak
- Pranav DV
- Sanjkeet Jena
Introduction
The National Basketball Association (NBA) is vastly considered to be the premier men’s basketball league in the world and is watched by millions of viewers every season. From the moment the jump ball is tossed at the beginning of each game, the question on everyone’s mind is “who will the winner be?”. Most NBA commentators and betting sites make fairly accurate predictions on the outcome of the game. The objective of this project is to build our very own “expert” to do the same using machine learning.
Demo
Brief Overview
The most basic model that we implemented considered a team to be an atomic unit. This meant that the data used to train the model was a team’s statistics instead of the players that constituted it. The outcomes predicted by this model were right about 70% of the time which is on par with most betting sites and expert opinions. Also, given that these games generally have an upset rate of ~30% it seems that our model was doing the best it could.
This however has an obvious flaw. Teams are often reformed each season and the statistics for the past season may no longer be reliable. To address this issue, we considered building a model using more nuanced data i.e. the player information. Our approach was to quantify the synergy between players on the same team as well as the dominance they assert over their adversary. In fact, we learnt that player identity alone is sufficient to calculate these quantities and make fairly accurate predictions.
Although up till this point our models were geared to predicting the game outcome, we now turned our attention to predicting more short term events which occur during the course of the game. Turnovers, steals and rebounds (both offensive and defensive) are examples of such events. To do so, our data had to be even more detailed which is why we looked at the box scores of a game. Box scores contain information of not only each event, but also on the players who were present on the court when that event occured. This data, combined with probit regression models, led us to understand that we can make predictions not only on the outcome of the game, but also on events that occur in it.
Finally we looked at a model to build a team that has the best chance at beating a given opponent. This is similar to how teams are formed in Fantasy Basketball leagues. Here we understood how the data was scraped, cleaned and merged and how its features were explored. We observed the performance of some base models and then with a Bayesian optimisation method, found the best parameters for a boosting model using lightGBM. We also looked at three different neural network architectures and noticed that, while deep learning models might not suit this dataset of limited size, it shows improvement compared to boosting models.
Results of games
Each game in a season of NBA is associated with many stats. These stats range from the number of points scored by each team in the game, to the percentage of baskets that were a result of a player’s assist. These statistics can be used to help a machine learning program learn how a particular team will perform against another team.
Performing web scraping using Python libraries like Selenium and BeautifulSoup on popular basketball statistics websites like Basketball-Reference.com and the official NBA Stats Website, we were able to extract the month-wise stats for each team that played a game in the regular NBA Season of 2018-19. After combining the month-wise stats with each game that was played in the season, we were able to obtain an extensive dataset which contained team-wise stats for every game in the season. On performing Exploratory Data Analysis, we were able to find highly correlated features which would have an undesired effect on the learning of the machine learning model. The following heatmap shows the correlation coefficients of some of the input features:
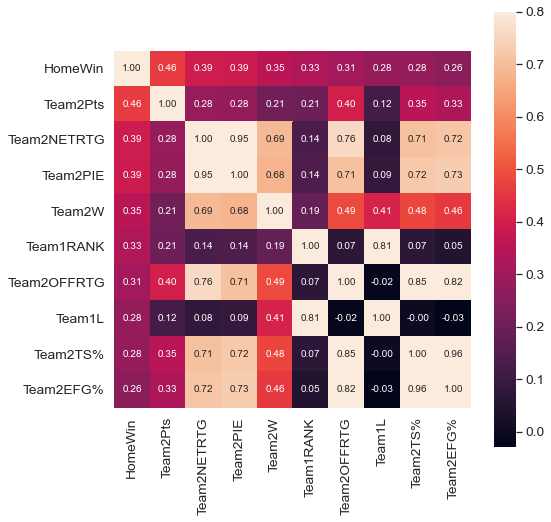
After preprocessing the data and fitting the model on the preprocessed data using several different machine learning model architectures, we were able to obtain a model that was able to successfully predict the outcome of NBA games with ~73% accuracy.
Box Score
In basketball, box scores provide detailed statistics about each player who is on the lineup for a game. Additionally, it contains some team-level information like the 5 players who started the game, team rebounds, etc. These box scores provide valuable insights on the skills of each player, and allows a machine learning model to learn certain performance metrics about each player and predict a player’s performance in a simulated scenario.
Keshav Puranmalka proposes in his paper to create novel features in order to more accurately predict the skills of a player. Box scores only provide advanced statistics for plays that occur on the basketball court, during the game. However, other features which might not be related to the actual basketball game may be of importance to predict a player’s (and the whole team’s) performance. Some examples may include the number of rest days between two games, the geographical distance travelled by the team between two games, etc. “Clutch” moments in a game (game situations which are more important than others) are also a major consideration when evaluating a player’s performance at a particular time in the game.
Using feature selection algorithms and Support Vector Machines (SVM) to predict the performance of team-level and player-level performances, the results prove to be ~2-3% more accurate than publicly available state-of-the-art predictors of NBA game outcomes.
Synergy
In Basketball, player-player chemistry plays a big role in predicting the output of the games. Here, the motivation of this model is to understand the role that player-player chemistry (synergy) may play in predicting game outcomes and providing quantitative predictions of chemistry between players.
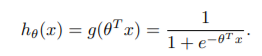
The inputs for our algorithm will be the identity of the players on each team for a given game. We will then use logistic regression with a linear model and a quadratic.
model to output a prediction on which team will win the match. We also provide a comparison using a multi-layer perceptron neural net.
Linear Model
Quadratic Model
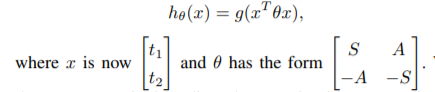
We’ll also take a look at the learned parameters of the quadratic model which will give us quantitative parameters to compare the chemistry of the players.
The feature vector for every team would have a length of total number of players. It would have 1s in positions corresponding to its players and 0s elsewhere. Using this as input to our quadratic model we get two matrices S and A.
- Diagonal elements of S - indicator of player’s individual skill
- Off-diagonal elements of S - indicator of how much the two players as teammates contribute positively to the win percentage of their team
- Off-diagonal elements of A - indicator of the difference in the players’ contribution to their teams’ winning chance when they are on opposing teams
These are very important parameters. Using these we can calculate how well would any two players fit together. Players i and j would fit together well if the value of S[i][j] is high and A[i][j] is low.
This work has a lot of potential as it can effectively predict which players should be paired together. Also, it can predict successful transfers and trades. But there are some drawbacks such as we have to include age as a factor. Also it doesn’t account for new players. Nevertheless, this has a lot of scope and can be explored further.
Positive and Negative Synergies
About the paper
Allan Z. Maymin et al.[4] provide a novel Skills Plus Minus (“SPM”) framework that can be used to measure synergies within basketball lineups, provide roster-dependent rankings of free agents, and generate mutually beneficial trades.
An evaluation on each player’s offense and defense in the SPM framework for three basic skill categories is done:
- Ball-handling Category: Steal, Non-steal turnover
- Rebounding Category: Rebound of a missed field goal, Rebound of a missed free throw
- Scoring Category: Made field goal (2 or 3 points),
The synergies of each NBA team is calculated by comparing their 5-player lineup’s effectiveness to the “sum-of-the-parts.” The framework generates mutually beneficial trades between teams. Because skills have different synergies with other skills, the framework predicts that a player’s value depends on the other nine players on the court.
While these box score ratings can measure an individual’s contributions, they do not necessarily explain how players interact on the court. For example, it is possible that the five best players in the NBA are all centers. In this case, a team with five centers may not be the optimal lineup, since there would be no one to bring the ball up the court or guard the quicker opposing guards.
Certain trades can also be predicted using the framework. It predicted that in the 2009-10 season, if the New Orleans Hornets traded Chris Paul for Deron Williams from the Utah Jazz, both the teams would have been a mutually beneficial trade.
The Probabilty of an event to occur is calculated using the below formula
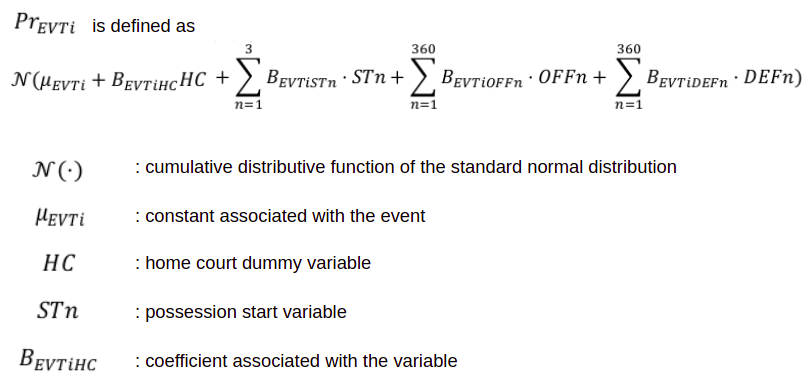
For example, the probabilty of a steal by Rondo is given as:
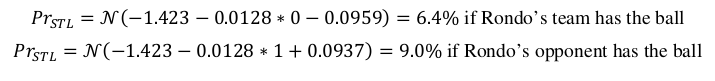
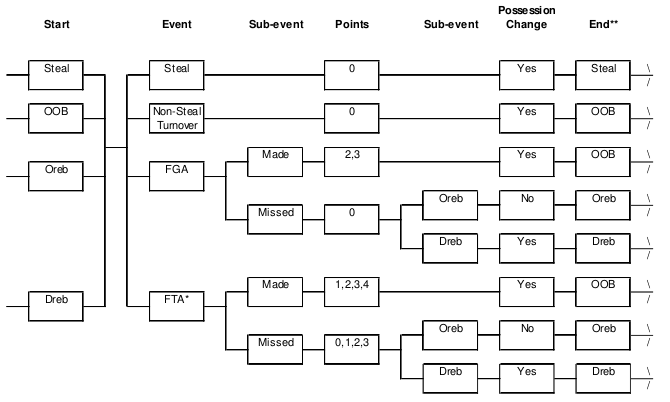
Using the probabilities the series of events can be predicted using the flow diagram
Individual Player Ratings
By this example we can explain how a player is rated. Let’s say we create a fictional player who has Ronnie Brewer’s “steals” ratings, but is replacement level in all other skills. We then simulate games where one team consists of the fictional player and four replacement players, and their opponent utilizes five replacement players. The estimated point differential of this game is the player’s ratings for that particular skill.
Synergies are measured by how many additional points a combination of two skills create. For example, Chris Paul’s offensive ballhandling is worth 4.8 points, while Reggie Evans’ offensive rebounding is worth 3.1 points. We calculate that a team with Chris Paul’s offensive ballhandling and Reggie Evans’ defensive rebounding will have a 8.1 point advantage. Therefore we calculate synergies as worth 0.2 points (8.1-4.8-3.1). Synergies are the difference between the point differential of the combined team and the sum of the two individual players; they tell us which types of players work well with one another.
For constructing a team, a few star players are chosen for a team and all the other players are made as free agents. By generating multiple combinations, a team can be completed by calculating the maximum team rating.
Generating Line ups
LightGBM
Gradient boosting refers to a class of ensemble machine learning algorithms that can be used for classification or regression predictive modeling problems.
Ensembles are constructed from decision tree models. Trees are added one at a time to the ensemble and fit to correct the prediction errors made by prior models. This is a type of ensemble machine learning model referred to as boosting.
Models are fit using any arbitrary differentiable loss function and gradient descent optimization algorithm. This gives the technique its name, “gradient boosting,” as the loss gradient is minimized as the model is fit, much like a neural network.
LightGBM is a gradient boosting framework that uses a tree based learning algorithm. It extends the gradient boosting algorithm by adding a type of automatic feature selection as well as focusing on boosting examples with larger gradients. It is widely used in cases of tabular data for regression and classification.
LightGBM is prefixed as ‘Light’ because of its high speed. Light GBM can handle the large size of data and takes lower memory to run. Tble his is suitable as the number of records in the dataset is about 1.2 lakhs. Another reason of why Light GBM is popular is because it focuses on accuracy of results.
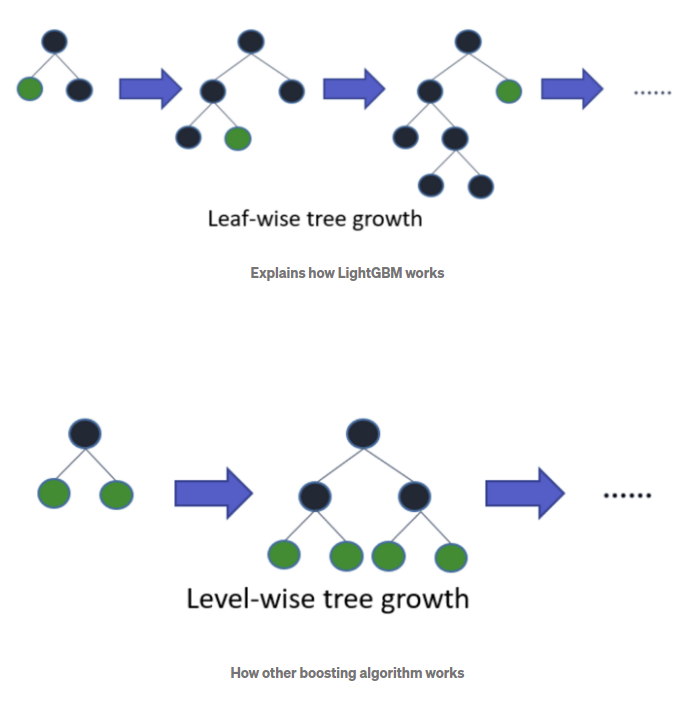
Since it is based on decision tree algorithms, it splits the tree leaf wise with the best fit whereas other boosting algorithms split the tree depth wise or level wise rather than leaf-wise. So when growing on the same leaf in Light GBM, the leaf-wise algorithm can reduce more loss than the level-wise algorithm and hence results in much better accuracy which can rarely be achieved by any of the existing boosting algorithms.
Bayesian Optimization
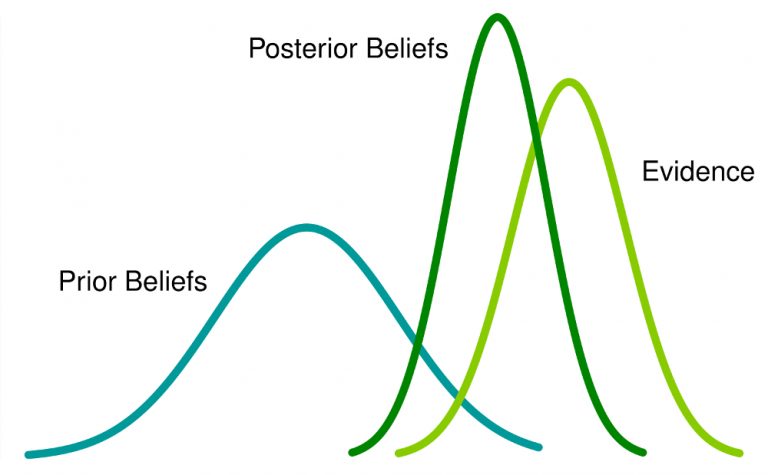
Bayesian Optimization is a probabilistic model based approach for finding the minimum of any function that returns a real-value metric. It is very effective with real-world applications in high-dimensional parameter-tuning for complex machine learning algorithms. Bayesian optimization utilizes the Bayesian technique of setting a prior over the objective function and combining it with evidence to get a posterior function.
Hyperparameter tuning by Bayesian Optimization of machine learning models is more efficient than Grid Search and Random Search. Bayesian Optimization has better overall performance on the test data and takes less time for optimization.
Neural Networks
In order to understand the insight that deep learning can give to this task, we observed 3 different neural networks. All of them were built using TensorFlow 2 with a Keras backend. Each of the models used the ReLU activation function in hidden layers, root mean square error for the loss function and the Adam optimizer. All of them were trained for 100 epochs.
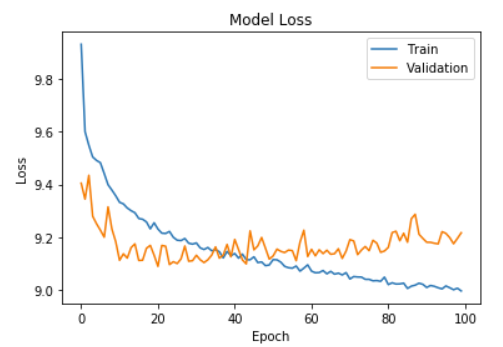
Model 1 consisted of 4 layers, with 64 and 32 units in the first and second hidden layers respectively. From the plot of training and cross validation errors, we can see that the model starts overfitting the data after the first few epoch since there is a significant difference in training and cross validation error which only increases as the training progresses.
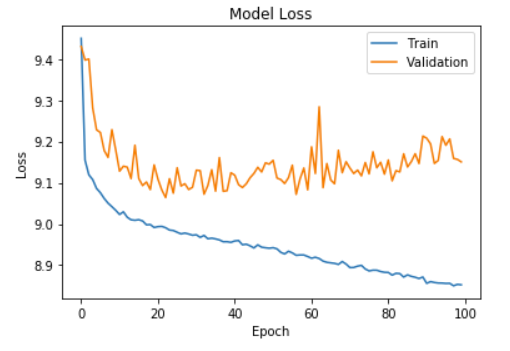
Model 2 consisted of 5 layers, with 64, 128 and 32 units in the hidden layers. Dropout regularization was implemented between the fourth and output layer as well. This model performed the best among the 3 since it did not overfit the data to a large extent and had fairly small differences in the train and cross validation errors.
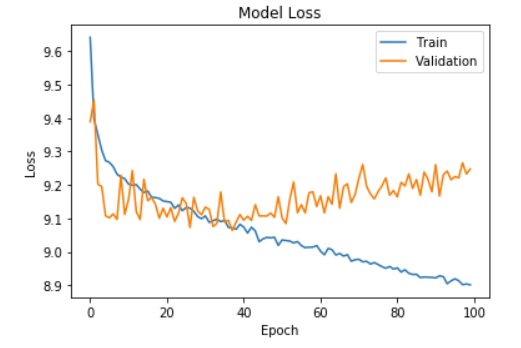
Model 3 also consisted of 5 layers but had 128,256 and 64 units in the hidden layers. Once again we added dropout regularization between the fourth and output layers. This model performed worse than model 2. Although increasing the number of units in the hidden layers often allows the model to learn more complex functions, in this case, the density of connections actually led to overfitting. We can observe this in the graph as well since the difference between the cross validation and train error increases consistently after ~40 epochs.
We can conclude that although deep learning might not be best suited for this task due to the limited size of the dataset, it does provide a slight improvement compared to the boosting models.
Genetic Algorithms
Genetic Algorithms are a search-based optimization technique based on principles taken from Genetic phenomena. They are frequently used to find optimal or near-optimal solutions to difficult problems, and in this case, used to solve the problem of Lineup Optimization by selecting the best combinations of players on a given set of games and predictions.
In GAs, we have a population of possible solutions for the problem in question. The solutions producing new children while going through the processes of recombination and mutation, and the process is repeated over various generations. Each individual solution from a population is assigned a fitness value. Like in Darwin’s theory of the survival of the fittest, the fitter individuals (aka solutions) are given a higher chance to mate and thus yield more “fitter” individuals. In this way, the algorithm keeps giving us better and fitter solutions over the generations, or until we reach a threshold. In this problem, the initial solutions, that is a set of random lineups are chosen as the first generation. Based on their fitness level, the solutions are allowed to mate and produce individuals while also being subject to mutation and recombination leading to the evolution of the random solutions into the optimaized lineups.
Expert Opinion
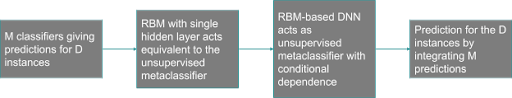
In conventional machine learning tasks, predictions are usually based on available historical and reliable data and disregard insights whose reliability can not be proven, for example, expert opinions, polls and betting odds. This is despite the many examples from daily life that support the validity and the accuracy of experts’ opinions in their fields of expertise. Another reason why these opinions have not been used is the lack of aggregated data in a systematic and objective fashion, but this is soon changing with the advances in NLP studies. For example, film critic reviews have been used to accurately classify the film’s performance at the box office using pre-trained models and word/sentence embeddings. To use expert opinions, there is a need to first rank the experts on the basis of the success of previous predictions made. Once these experts are ranked, their opinions are weighted based on their reliability which is derived from their ranking. This is then used to train the ensemble of experts classifier which gives us the best possible outcome of the game. A potential issue with this method is that it might be difficult to get the results of each game and map it to the expert opinion as the text search domain is very large. For this, it would be a better idea to look at this problem in an unsupervised way. Parisi et. al., 2014 described a way to rank classifiers and then build a meta classifier in an unsupervised manner. The workflow is described briefly in the diagram below. The method is expected to be quite useful in solving our problem.

We can even take one step further and try deep unsupervised learning approaches as described in Shaham et. al., 2016 who used a Restricted Boltzmann Machine based Deep Neural Network to create an ensemble of predictors in an unsupervised method.
Using expert opinions for game prediction is not a very widely studied or used topic and there is a lot of scope in the field especially with the amount of data being generated for the same.
References
[1] Fazelinia et. al., “Using Experts’ Opinions in Machine Learning Tasks”, 2020.
[2] Parisi et. al., “Ranking and combining multiple predictors without labelled data”, 2014.
[3] Shaham et. al., “A Deep Learning Approach to Unsupervised Ensemble Learning”, 2016.
[4] Allan Z. Maymin et al. “NBA Chemistry: Positive and Negative Synergies in Basketball”, 2013