Project Members
- Ajethesh Kumar
- Diptesh Banerjee
- Yuvasankar B
Abstract
Most of us have tried to get a window seat when travelling by air so that we can dreamily gaze out of the window at 35,000 feet. But have you ever paid attention to why the windows are round/rounded rectangular and not square like the windows in our homes? The aim of this project is to analyze the stress concentration and fatigue for different window shapes and material of fuselage and try to optimize the window shape for better endurance to the in-flight stresses.
Aim
The aim of this project is to analyse and optimize the aircraft fusalage and window panes for longer life and customer satisfaction.
What is Stress concentration?
- A stress concentration (also called a stress raiser or a stress riser) is a location in an object where the stress is significantly greater than the surrounding region.
- Occur when there are irregularities in the geometry or material of a structural component.
- Arises from holes, grooves, notches and fillets. Stress concentrations may also occur from accidental damage such as nicks and scratches.
- Degree of stress concentration is given by stress concentration factor, which is the ratio of the highest stress to the nominal far field stress.
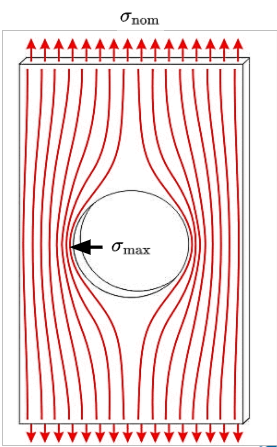 Figure 1:Stress concentration
Why is it so dangerous?
- Stress concentrations may sometimes go unnoticed and lead to catastrophic failure of components which may or may not be life threatening but are uneconomical in either case.
- A nominal stress which is within the safety limits may still lead to stress concentrations beyond this safety limit.
- The figure 3 shows de Havilland DH.106 Comet was the world’s first commercial jet airliner and had its first flight in 1952. As seen on the right, it had square windows.
- However, within a year of entering airline service, three Comets were lost within twelve months after suffering catastrophic in-flight break-ups. Two of these were found to be caused by structural failure resulting from metal fatigue in the airframe, a phenomenon not fully understood at the time.
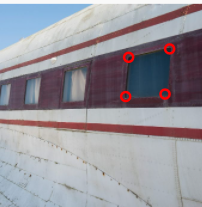 Figure 2:The de Havilland DH.106 Comet was the world’s first commercial jet airliner and had its first flight in 1952. As seen on the right, it had square windows
What is fatigue?
- Occurs with dynamic loading
- In materials science, fatigue is the weakening of a material due to cyclic loading which is caused by localized damage that results in the initiation and growth of cracks.
- There are 3 types of cyclic loading as shown on the right
- Fully reversed loading
- Zero based loading (the one used in this project)
- Normal fluctuating loading
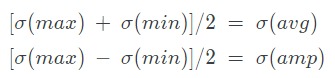
- PS : for static loading,

 Figure 3:Fatigue graph
Why is fatigue analysis important?
- With failure of component possible at stresses way below safety limit due to fatigue, it is important to predict the fatigue life or number of cyclic loadings the component can withstand before giving in.
- This is done with the help of S-N curve (stress amplitude is plotted against logarithm of number of cycles) as shown on the right.
- Failure points are plotted by determining the number of cycles it took for the component to fail for a given stress amplitude (by experiment).
- It is seen that for stresses below endurance limit, the component can withstand infinite cycles theoretically.
- Our aim is to ensure that stresses developed on the fuselage for different materials is well below endurance limit.
 Figure 4:S-N Curve
The CAD Model
- The basic fuselage structure was modelled in Solidworks according to dimension and imported to ANSYS Static Structural.
- Windows were modelled in ANSYS Design Modeler.
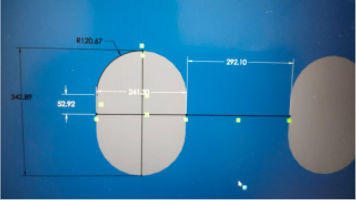 Figure 5.1:Dimensions and spacing of windows
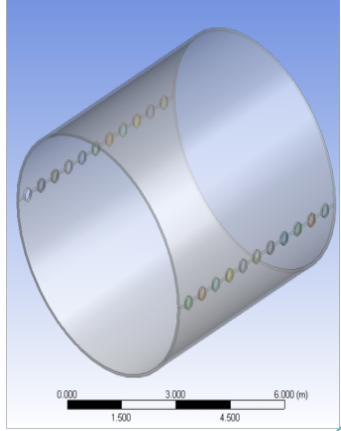 Figure 5.2:cross-section
Meshing
- Element size (Default 0.54335m)
- Growth rate (Default 1.85m)
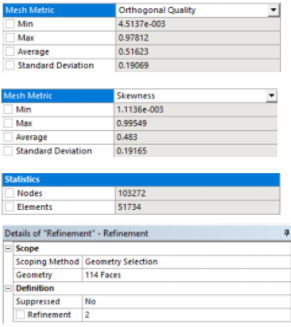 Figure 6.1:Meshing Parameters
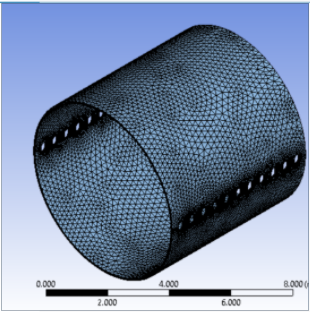 Figure 6.2:Meshed cross-section
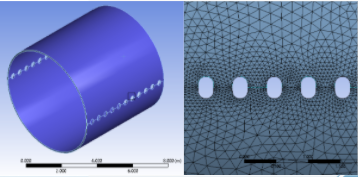 Figure 6.3:Model and window mesh
Constraints, loading and material assignment
- The front and back annular faces of the fuselage were constrained as “Displacements”. This means the fuselage is free to expand in the X-direction (or outwards as shown). Y and Z components are set the 0 as we don’t want the fuselage to rotate or move along the Z-direction while laoding.
- A pressure of 1 atm or 101325 Pa is applied on the interior walls as shown. This is to simulate atmospheric conditions maintained inside the cabin for passenger comfort.
- The fuselage was assigned AL 7075-T6 and windows were assigned.
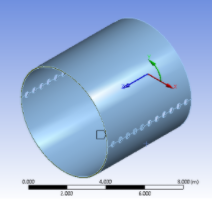 Figure 7.1:Coordinate System
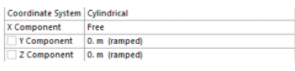 Figure 7.2:Coordinate System Settings
Figure 7.3:Constraints and boundary conditions
Figure 7.2:Coordinate System Settings
Figure 7.3:Constraints and boundary conditions
Results
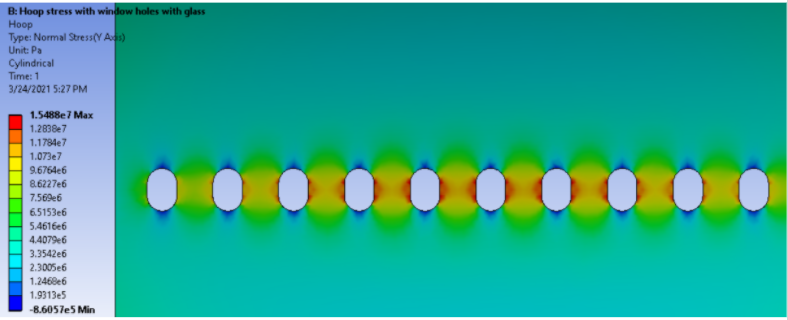 Figure 8.1:Hoop stress contour
This above picture is of Hoop stress developed in the fuselage. The stress concentration can be seen at the window corners. Hence confirming the window corners to be the location of maximum stress concentration.
Figure 8.1:Hoop stress contour
This above picture is of Hoop stress developed in the fuselage. The stress concentration can be seen at the window corners. Hence confirming the window corners to be the location of maximum stress concentration.
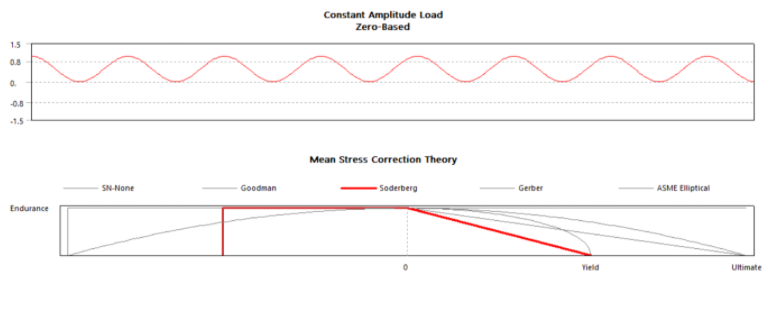 Figure 8.2:Load condition and selected failure theory
This above picture is of cyclic loading applied to the fuselage for fatigue analysis and as seen in the second graph. We have chosen the Soderburg failure theory as it is not much conservative and yet it considers all failure regions.
Figure 8.2:Load condition and selected failure theory
This above picture is of cyclic loading applied to the fuselage for fatigue analysis and as seen in the second graph. We have chosen the Soderburg failure theory as it is not much conservative and yet it considers all failure regions.
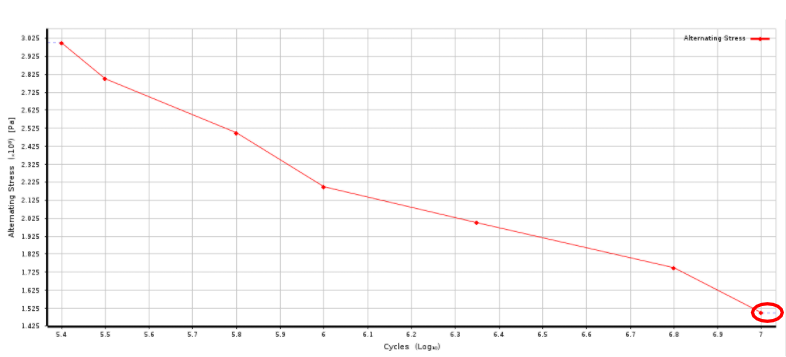 Figure 8.3:The Failure cycle graph of AL 7075-T6
This image shows the magnitude of alternating stresses decreasing as the number of cycles increase. The maximum number of cycles being 10^7. This graph indicates the expected life of our material.
Figure 8.3:The Failure cycle graph of AL 7075-T6
This image shows the magnitude of alternating stresses decreasing as the number of cycles increase. The maximum number of cycles being 10^7. This graph indicates the expected life of our material.
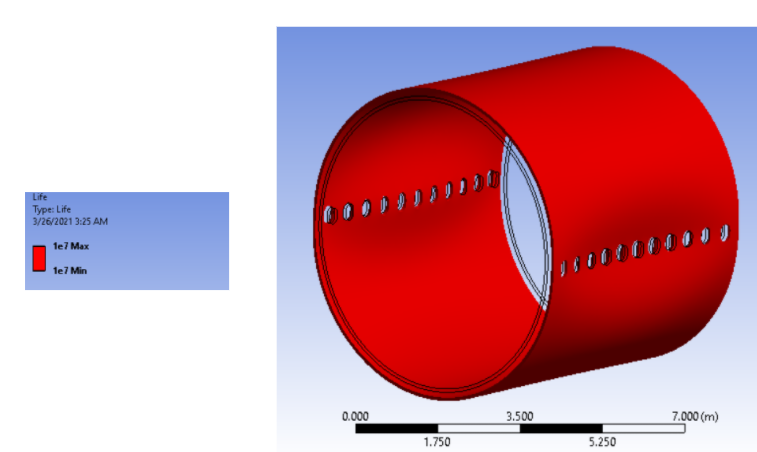 Figure 8.4:Life cycle contour based on fatigue analysis
This image is the result image of the fuselage after fatigue analysis showing the maximum no of cycles. It indicates that the fuselage life is very long for the selected shape and material.
Figure 8.4:Life cycle contour based on fatigue analysis
This image is the result image of the fuselage after fatigue analysis showing the maximum no of cycles. It indicates that the fuselage life is very long for the selected shape and material.
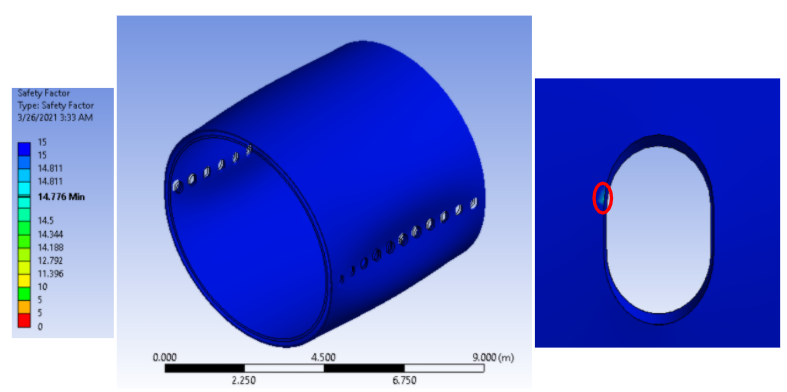 Figure 8.5:Safety factor contour based on fatigue analysis
As seen in the above image the minimum safety factor of our fuselage near the window edges is 14.776 which is very high. It indicates that our fuselage shape and the material have very high resistence against the applied loading conditions.
Figure 8.5:Safety factor contour based on fatigue analysis
As seen in the above image the minimum safety factor of our fuselage near the window edges is 14.776 which is very high. It indicates that our fuselage shape and the material have very high resistence against the applied loading conditions.
Conclusion
- As the stress concentration is a major factor while considering the shape of the windows, it has been found that the stress concentration decreases as the number of sharp edges decreases.
- Considering the above point the shape of the windows are made to be oval at the end to decrease stress concentration
- Reinforcement with ribs on the fuselage absorbs the stresses developed and hence decrease the stress concentration overall.