Mentors
- Achinthya B Krishna
- Tarushi Neel Lohit
Members
- Dhruv Gandhi
- Meghna Sarma
Aim
To address the complexities involved in generating phase diagrams, and bring in efficient solutions by the help of CALPHAD software.
Introduction
Till about the late fifties most phase diagrams were determined by the measurement of certain physical properties or quantitative microscopy using light optics or X-ray diffraction. The thermodynamic approach was formulated lately by Kaufman and Bernstein. Typically, thermodynamic calculations of generating free energy v/s composition graphs are carried out manually, and then common tangents are plotted to get the phase diagram. This approach might be convincing in the systems at small scale. But a more efficient way would be to take help from computers to carry out the labor work. Hence after years of hard work by the group of metallurgists from University of Boston and KTH Royal Society, they have come up with a data driven software “Thermo-Calc”.
Revision of Solutions and Solid state
The members were given a week to revise all the concepts of Solutions and Solid state which they had covered in their 12th grade and during their JEE preparation.
First exposure to Phase Diagrams
The members went through the lectures on phase diagrams from NPTEL lecture series, on “Basics of Material Science Engineering”. The members learnt about binary phase diagrams, phases and components, composition and proportion of phases present in a system, Eutectic reaction, different types of alloys and Gibbs’ phase rule. The concepts proved useful for understanding the phase diagrams and generating them in Thermo-Calc.
Generating Phase Diagrams
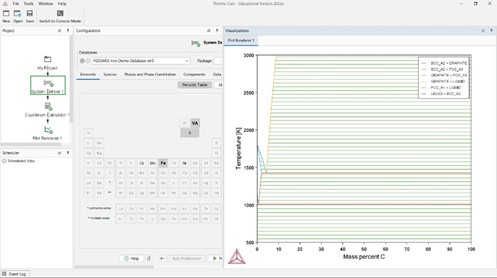
Members used the free version of Thermo-Calc to generate the Iron-Carbon phase diagrams in the graphical mode, after learning how to operate Thermo-Calc through a YouTube playlist for the same.
Here are a few simulations:
Representing the Fe-C phase diagram:
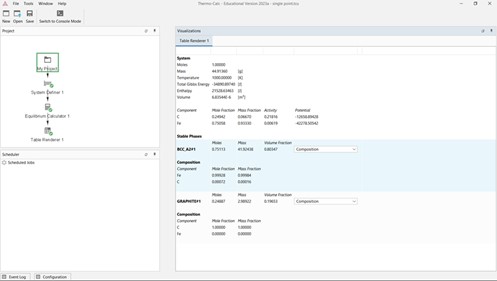
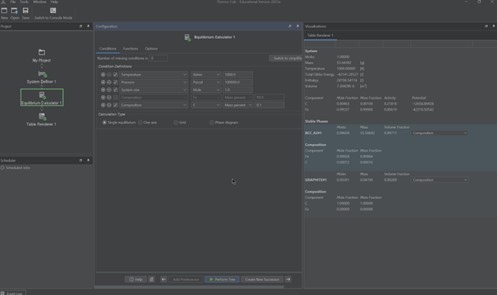
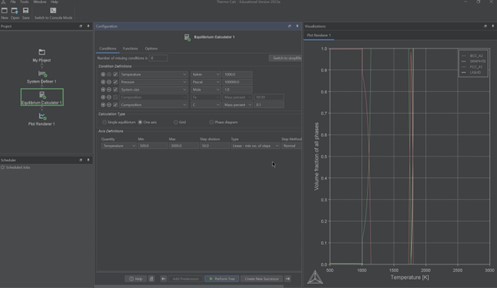
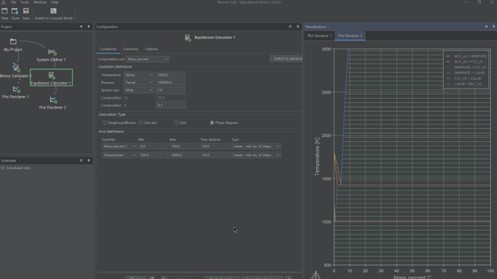 Representing the conditions for Single Point Equilibrium calculations:
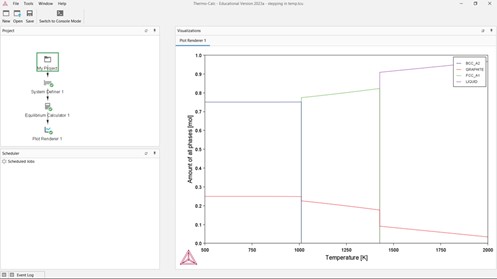
 Representing the Property Diagram:
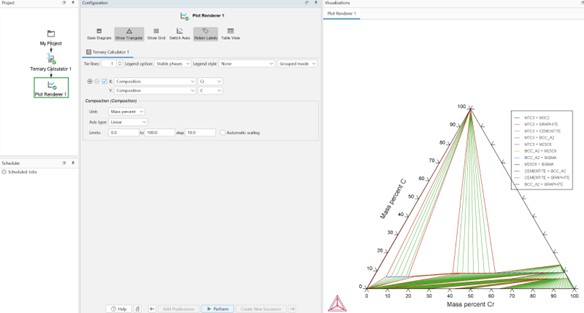
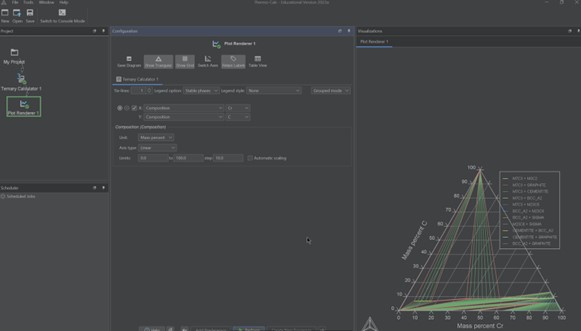
 Representing the Ternary Phase Diagram:
Technical Writing
Members went through a brief history on Calphad(Calculation of Phase Diagrams) and learnt about its importance. They also prepared a report on the same, wherein they were exposed to the skill of technical writing. The report elaborated on Calphad’s origin, how early phase diagrams were calculated, how the advent of computers helped in calculating phase diagrams and about the first Calphad journal.
Metallurgical Thermodynamics
Members went through a series of lectures on advanced Metallurgical Thermodynamics which gave them a deeper insight on the thermodynamics behind Phase Diagrams and their generation. They learnt about free energy, stability, equilibrium and how thermodynamic rules affect phase diagrams.
Conclusion
The project enabled the members to learn about the Phase Diagrams, the way they were generated before the software was developed, and how the software made calculation of Phase Diagrams much easier. The members also studied about the underlying thermodynamic principles behind the generated Phase Diagrams and were successfully able to generate the Phase Diagram of Fe-C alloy and the property diagrams on their own.
References
1.) NPTEL lecture series on “Introduction to Materials Science and Engineering”, by Prof.Rajesh Prasad ,IIT Delhi https://archive.nptel.ac.in/courses/113/102/113102080/ 2.) “Materials science and Engineering , An Introduction” by William D Callister. 3.) “Alloy Phase Equilibria”, A. Prince 4.) A brief history of CALPHAD, P.J.Spencer
5.) CALPHAD tutorials