Project Guide
- Dr. Dastagiri Reddy
Mentors
- Anirudh Singh Solanki
- Raghuram Kannan
- Apurva S
Members
- Abhishek Satpathy
- Guddati Sri Sai Akhil
- Calvin Dominic Fernandes
- Harish Dendukuri
- Adithya Srihari Rao
- Yanvitha Totakura
Acknowledgements
During the course of the project, we were able to gain knowledge in the fields of Audio Processing and Deep Learning, and we found the experience of working on these topics very interesting. Hence, we express our deep gratitude to Dr. Dastagiri Reddy for giving us an opportunity to work on this project.
Aim
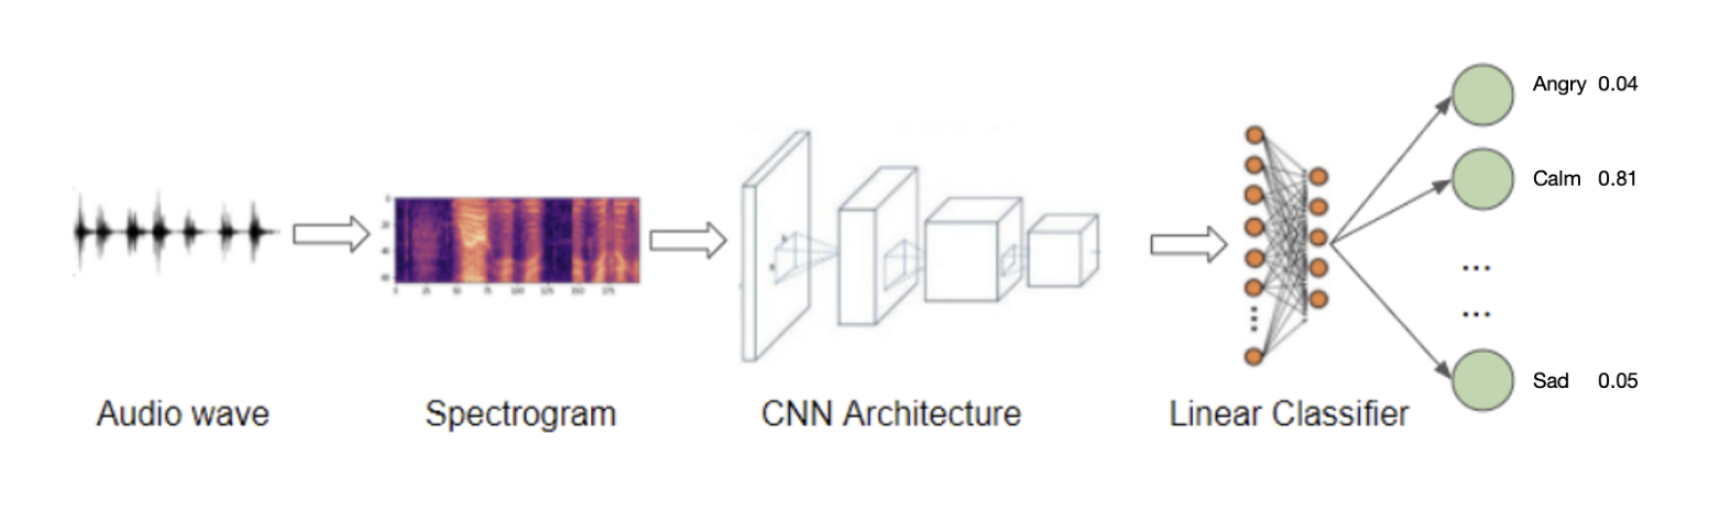
The aim of this project is to build a deep learning model using CNNs which recognizes emotion based on speech.
Introduction
Speech is a complex signal which contains information about the message, speaker, language and emotions. Emotion on other side is an individual mental state that arises spontaneously rather than through conscious effort.
Speech Emotion Recognition is the act of attempting to recognize human emotion and affective states from speech. This is capitalizing on the fact that voice often reflects underlying emotion through tone and pitch. In this project we have used deep learning to implement CNNs to help us identify emotion in speech.
There are various kinds of emotions which are present in a speech. The ones we will be analyzing for are: angry, calm, disgust, fear, happy, neutral, surprised, sad.
Libraries Used
- Pandas
- Numpy
- Matplotlib
- Seaborn
- OS
- Librosa
- Tensorflow->Keras
Datasets
Toronto emotional speech set (Tess)
There are a set of 200 target words spoken by two female speakers, resulting in 2800 data points in total.
Surrey Audio-Visual Expressed Emotion (Savee)
4 male speakers, 480 audio files, same sentences were spoken in 7 different emotions.
Ryerson Audio-Visual Database of Emotional Speech and Song (Ravdess)
2452 audio files, with 12 male speakers and 12 Female speakers, the lexical features (vocabulary) of the utterances are kept constant by speaking only 2 statements of equal lengths in 8 different emotions by all speakers.
Crowd-sourced Emotional Multimodal Actors Dataset (Crema-D)
7442 audio files, 91 different speakers (48 male and 43 female), different statements are spoken in 6 different emotions and 4 emotional levels (low, mid, high and unspecified).
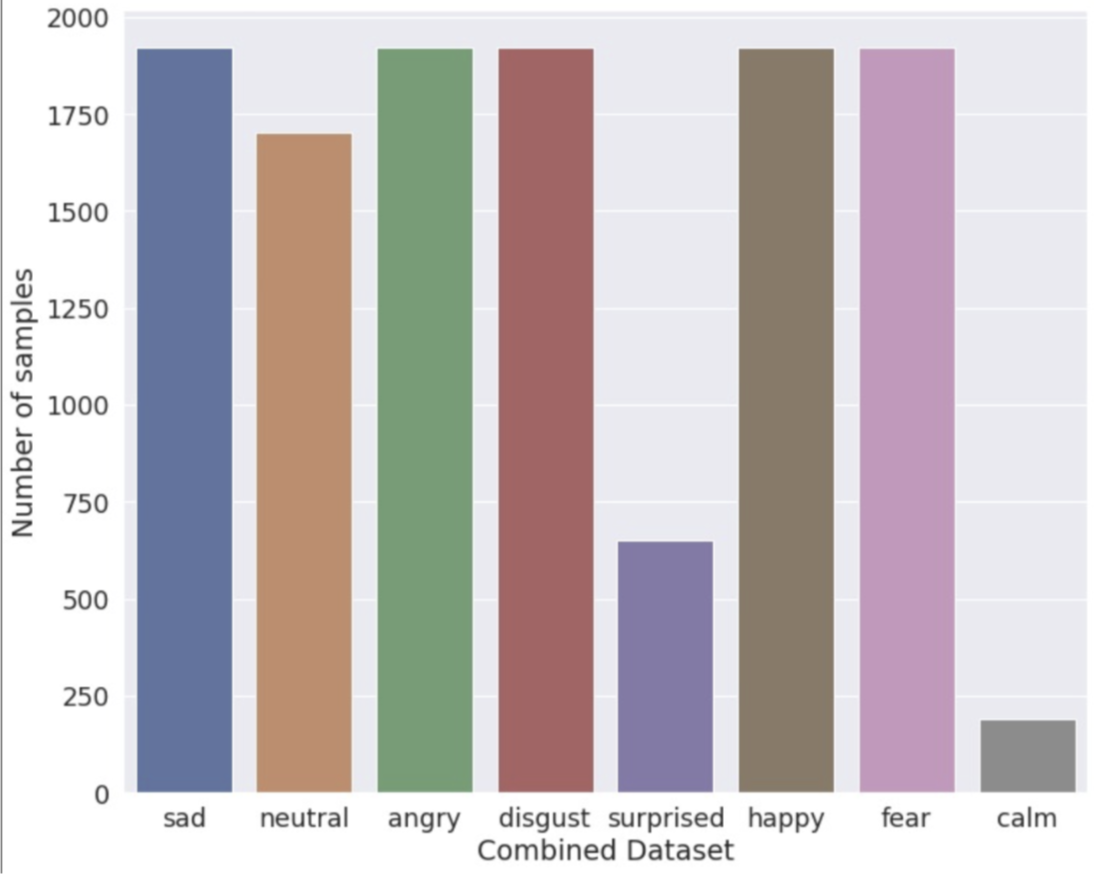
Bar graph representing the number of audio samples in each emotion:
A waveform, frequency domain representation and mel spectrogram of a sample audio clip is shown below:
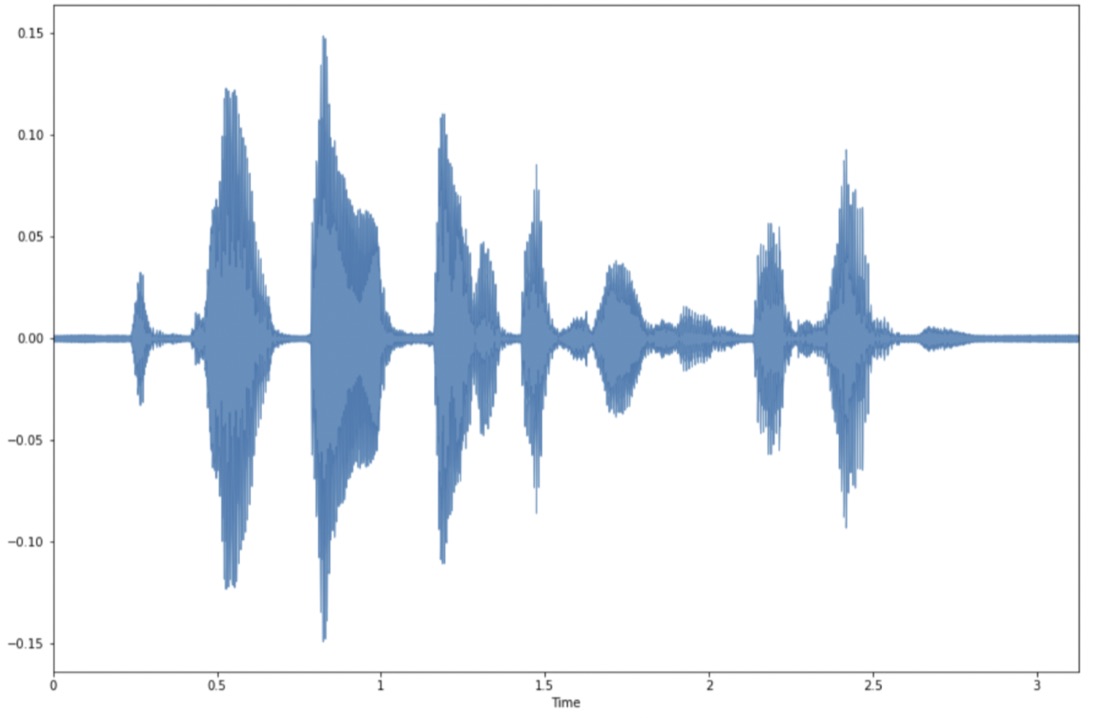
The time domain representation represents the amplitude of the signal at each point in time.
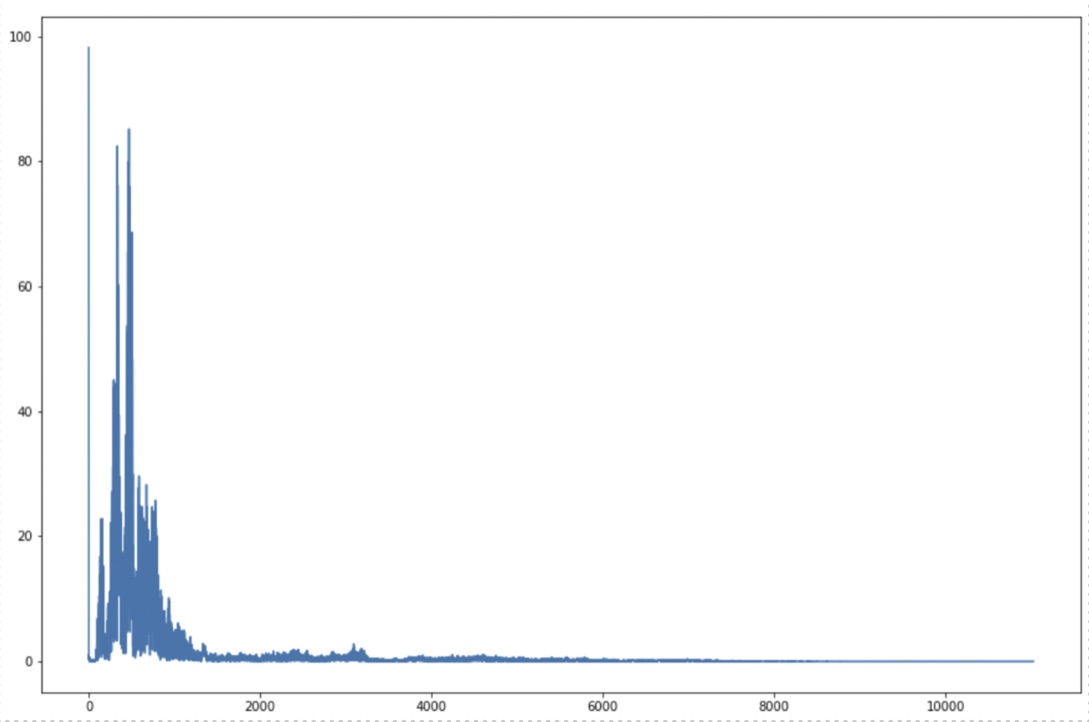
The frequency domain representation tells us about the different frequencies that are present in our signal.
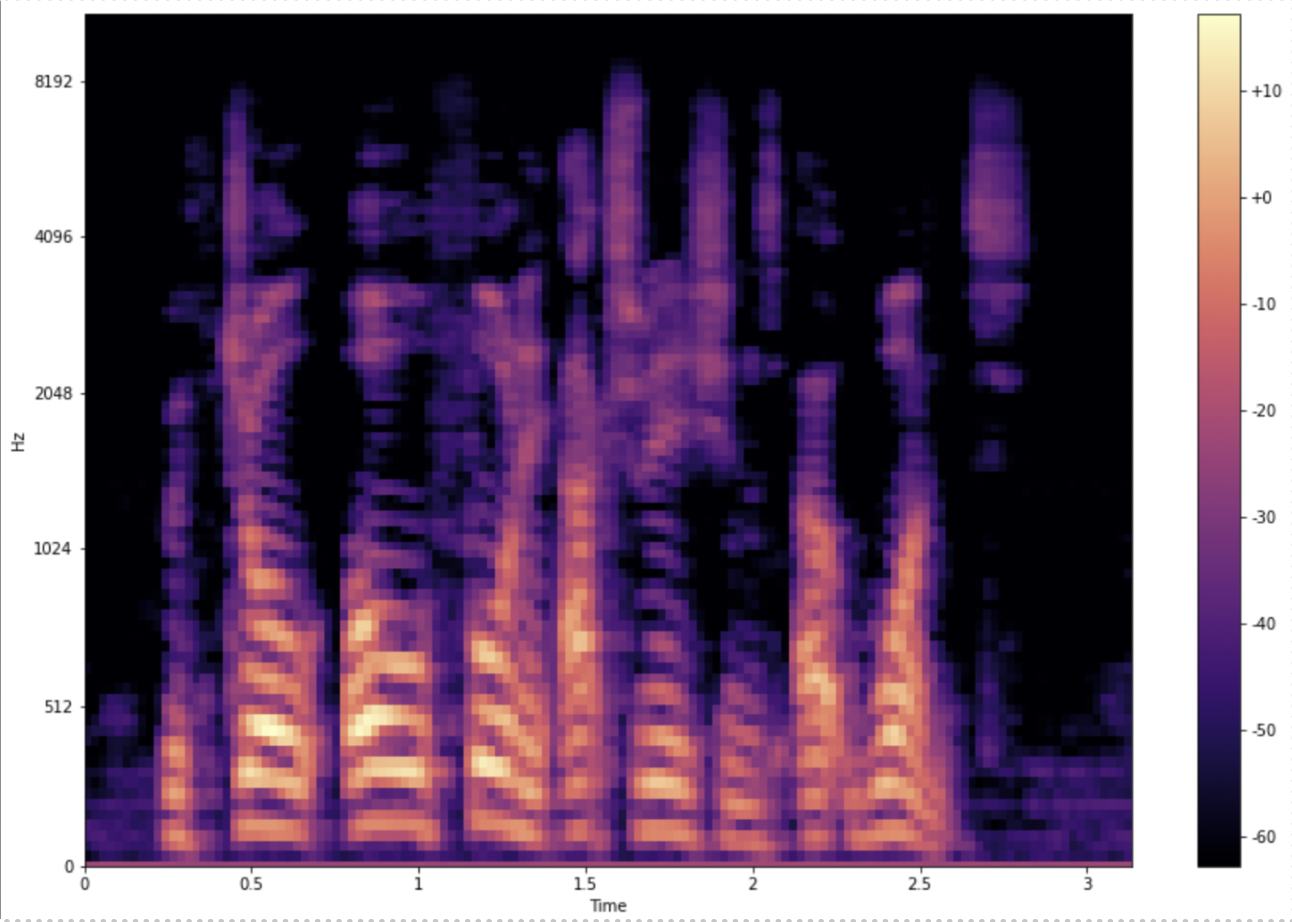
The above figure is a mel spectrogram for an audio clip.
We have similarly represented and studied the audio features for other audio samples as well.
Data Augmentation
A key part of deep learning is to feed the neural network with a lot of data so that it can learn to generalize well. Data Augmentation is used to generate additional audio file samples by slightly modifying already existing data. This helps us to minimize overfitting of our model.
Noise injection
In this process we add white noise to an audio sample, hence producing additional audio samples having slightly different audio features but representing the same emotion.
Time stretching
Time stretching is the process of changing the speed or duration of an audio signal without affecting its pitch.
Pitch scaling
It is the process of changing the pitch without affecting the speed. It should only be used to a small extent as pitch forms an important part of emotion.
Feature Extraction
The following features have been extracted from each audio sample. These set of features helps the model distinguish each audio sample from the another.
Zero Crossing Rate
The zero-crossing rate is the rate at which a given signal changes from positive to zero to negative or vice versa.
Chroma
Chroma and chroma related features are a powerful tool for analyzing music whose pitches can be meaningfully categorized (often into twelve categories) and whose tuning approximates to the equal-tempered scale.
Mel-Frequency Cepstral Coefficients
The Mel-Frequency Cepstrum(MFC) is a representation of the short-term power spectrum of a sound, based on a linear cosine transform of a log power spectrum on a nonlinear mel scale of frequency. Mel-frequency cepstral coefficients are coefficients that collectively make up an MFC.
Root Mean Square Energy
RMS is a meaningful way of calculating the average of values over a period of time. With audio, the signal value (amplitude) is squared, averaged over a period of time, then the square root of the result is calculated.
Mel Spectrogram
A spectrogram is a visual way of representing the signal strength of a signal over time at various frequencies present in a particular waveform. Mel spectrogram is a spectrogram that is converted to a Mel scale. The Mel scale mimics how the human ear works, with research showing humans don’t perceive frequencies on a linear scale, rather perceive frequencies on a logarithmic scale. Humans are better at detecting differences at lower frequencies than at higher frequencies.
Convolutional Neural Network
CNNs or convolutional neural nets are a type of deep learning algorithm that does really well at learning images. That’s because they can learn patterns that are translation invariant and have spatial hierarchies.
By leveraging this power of CNN, it could also be used to classify audio clips. We can extract features which look like images and then shape them in a way in order to feed them into a CNN.
That’s exactly what’s used in our project, extracting audio features and then shaping them into a multi-dimensional matrix, which is then fed into the CNN for training. This builds a robust model which is capable of classifying the emotions of an audio clip.
Model Architecture
We have used an alternate sequence of Convolutional Layers and MaxPooling Layers for our Model. Our model also includes other layers like
Dropout->it randomly ignores a set of neurons in the model in order to reduce its complexity and also helps reduce overfitting. Flatten-> it converts the output from the Convolutional and MaxPooling Layers into a 1-dimensional array for inputting it to the next layer. Dense-> it was used as the output layer for classifying the emotion of the audio clip.
ReLU is the activation function used for all Convolutional Layers.
We have also used Softmax as the activation function for the final layer as our model predicts a multinomial probability distribution.
Using ReduceLROnPlateau helps us monitor the training loss and if no improvement is seen for a patience number of epochs, the learning rate is reduced by a certain factor.
The learning rate was initially set to 0.001 and was adjusted according to ReduceLROnPlateau throughout the process of training.
The loss function used in this model is categorical_crossentropy.
Adam optimizer was used along with a batch size of 32 and 100 epochs. The above Hyperparameters could still be slightly tweaked to further improve accuracy.
The kernel size used in the convolutional layers are either 3 or 5 and the pool size in the maxpooling layers are all set to 3 making strides of 2.
Result
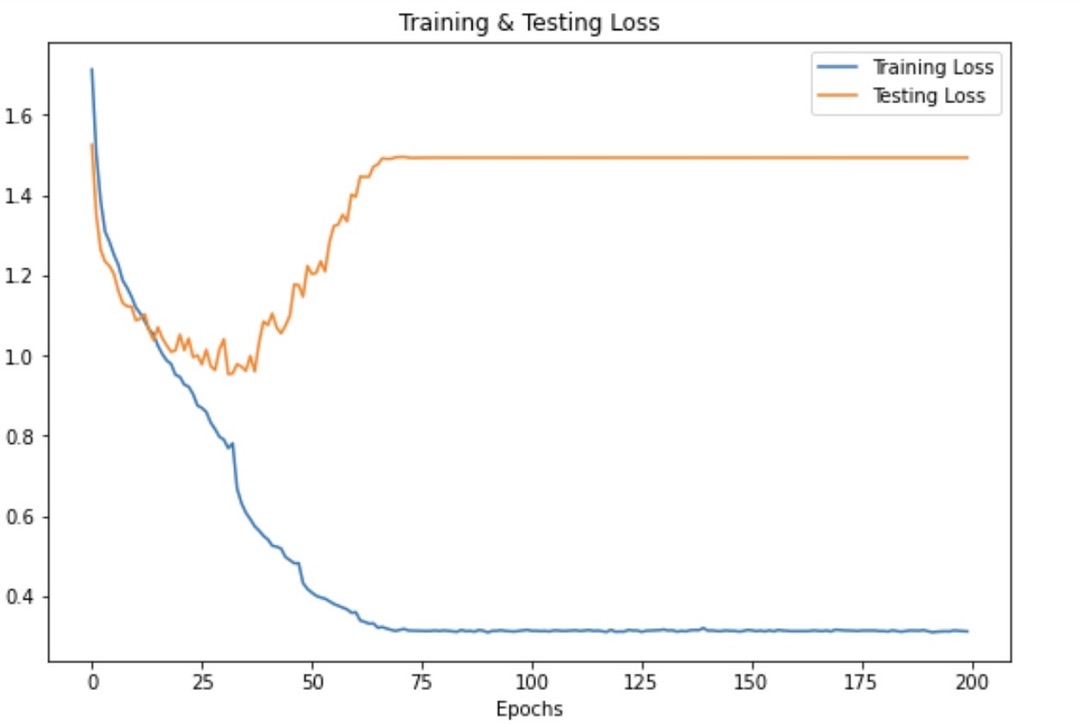
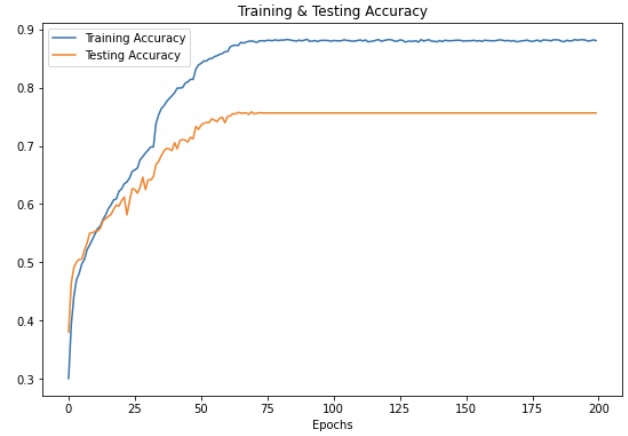
On the test set, we have achieved an accuracy of 89% and an accuracy of 74.76% on the validation set. We still plan on improving the accuracy of our model.
A snippet of the predicted output is shown below
Conclusion
Through this project, we learnt and showed how we can extract audio features using Librosa and implement deep learning using Keras to predict emotion from speech audio data and some insights on the human expression of emotion through voice.