Mentors
- Pratham Nayak
- Rakshit P
- Suresh Kamediya
Members
- Akheel Muhammed
- Mehul Todi
- Rohan Kamat
- Swetha Mary Thomas
Aim
- To build an SIR model and to generate a contact network to perform epidemiological simulation
- To find an optimal vaccine allocation strategy based on various simulations
- To build a web interface that allows users to visualize the outcomes of their epidemic control decisions
Introduction
With a clear example in front of us today, we know how a disease can make it’s way through a population and cause havoc in the community. In this project, we have built an SIR model to visualize how an epidemic progresses in a small community with the help of a contact network graph. We have considered a small subset of the population to be initially infected who later come in contact with others within the community and spread the disease. Due to scarcity of resources, optimal vaccination strategies are of utmost importance in order to control the spread. We have implemented 3 determinisitc vaccination strategies and have compared these with an ML based vaccination strategy for the NP-hard problem.
Models Used
SIR Model
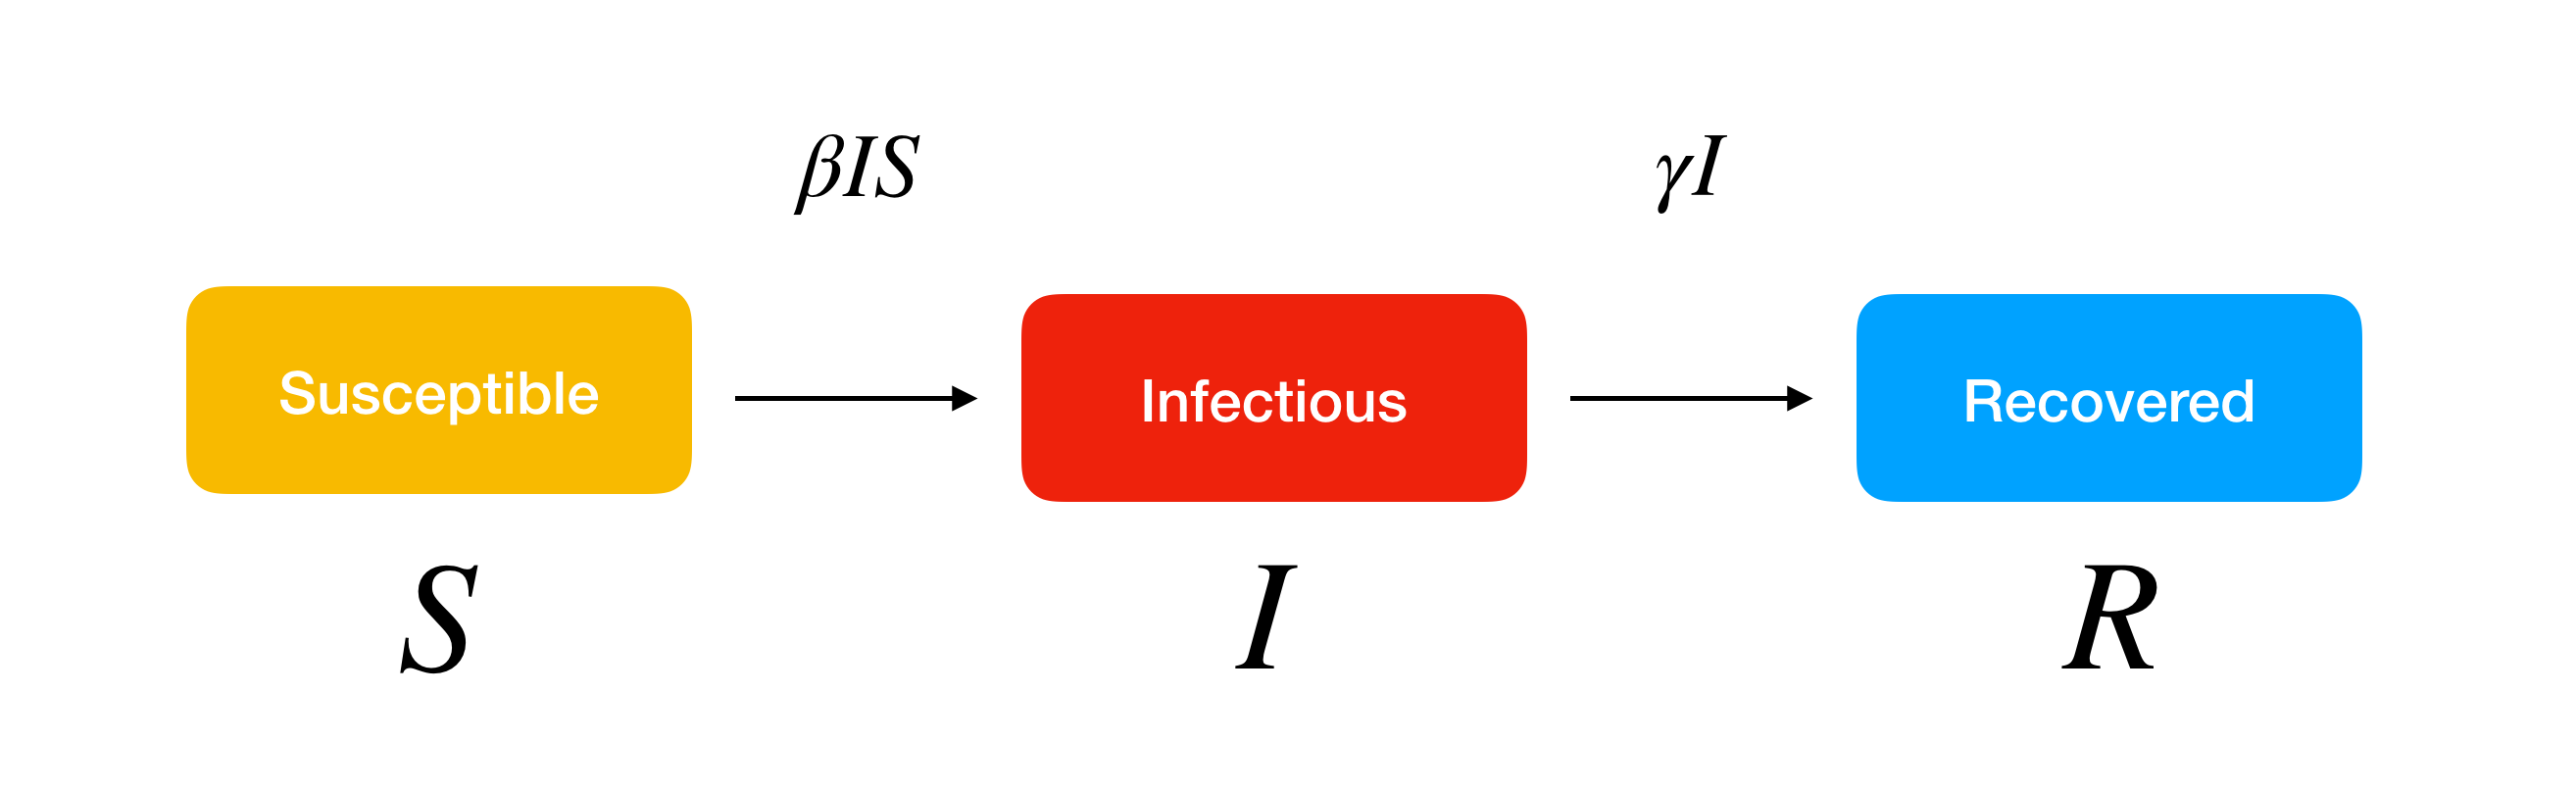
In general, an SIR model is a compartmental model wherein individuals within a closed population are separated into 3 mutually exclusive groups or compartments, namely Susceptible, Infected and Recovered, based on their disease status.
The SIR model is defined by only 2 parameters: the effective contact rate (β), which affects the transition from the susceptible compartment to the infected compartment, and the rate of recovery (γ), which affects the transition from the infected compartment to the recovered compartment.
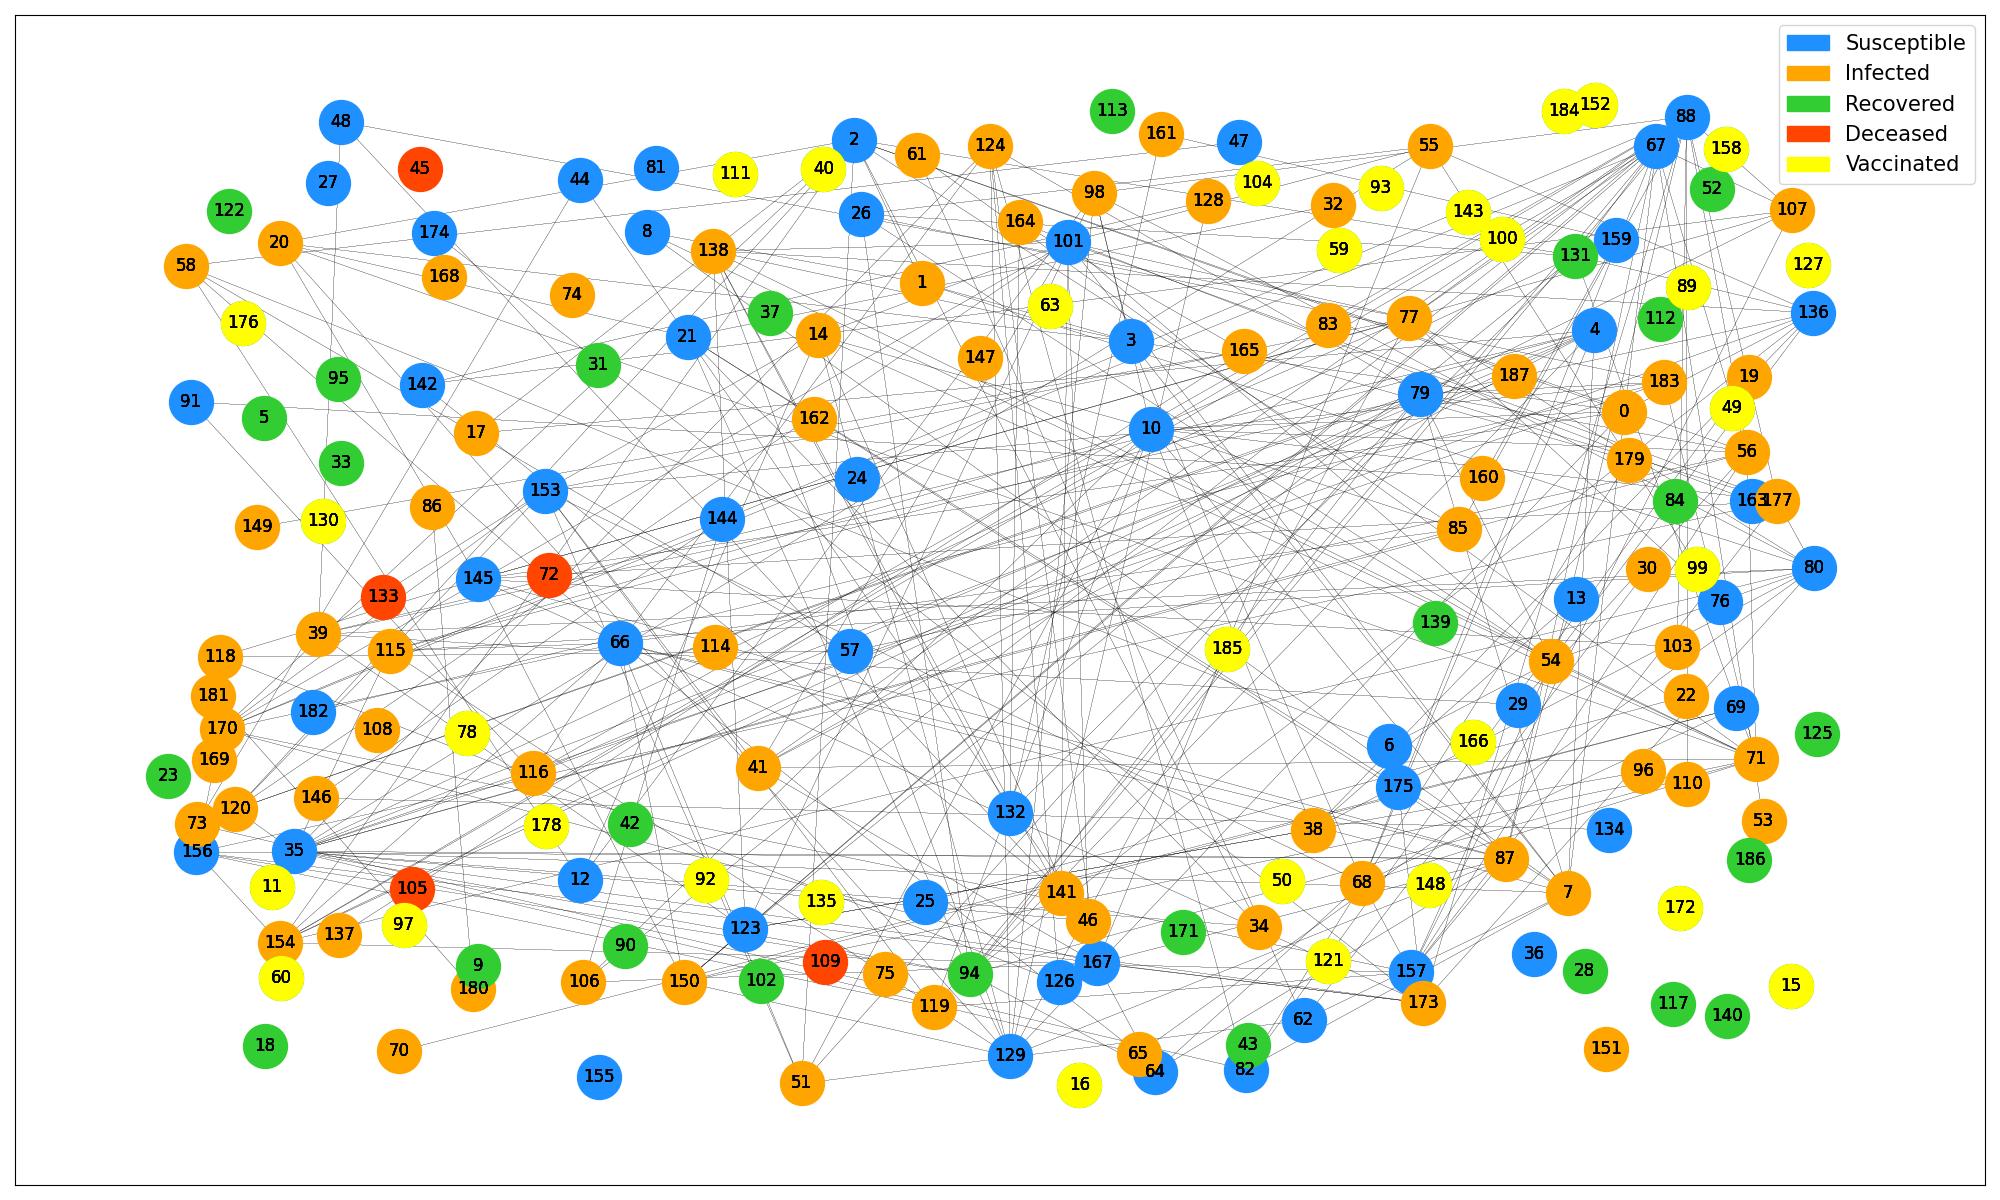
In the SIR model that we have implemented, we have assumed there to be 4 compartments – Susceptible, Infected, Recovered as well as Deceased.
In the simulation, we are predicting the progression of an epidemic in a community including apartments, offices, schools, and homes over a period of one month. The dataset for the same has been generated using a script.
We have also considered a group of people to be vaccinated on day 5 based on 3 different vaccination strategies – Random Vaccination Strategy, Degree Based Vaccination Strategy and Occupation Based Strategy.
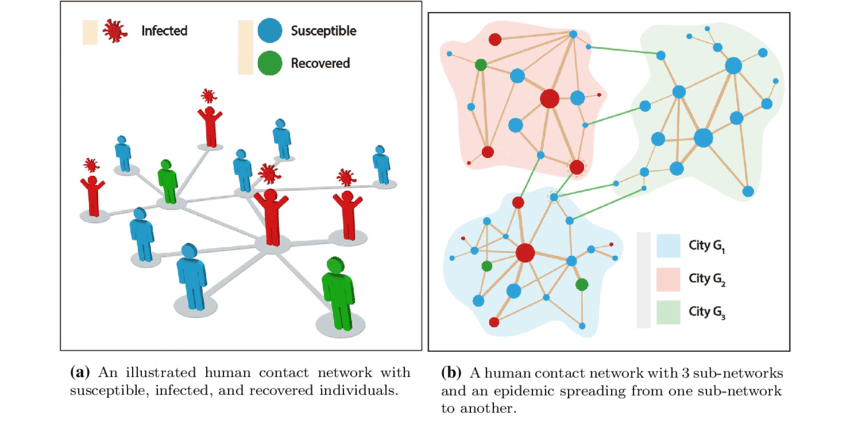
Contact Network Graph
In the contact network model, people in the community are represented by the nodes of the contact graph and their contacts are represented by the edges. Each compartment is assigned a color and as people move from one compartment to the other, the color of the nodes change accordingly
Vaccination Strategies
We have employed the following metrics to evaluate our vaccination strategies
- Peak number of infections
- Number of deaths
1. Random Strategy
In this vaccination strategy, we vaccinate a given percentage of the total population randomly after a few days of the disease outbreak offset. By random we mean that we do not choose the people to vaccinate based on any condition, but choose them randomly from the population. Once we vaccinate a few people the Graph showing the number of susceptible, infected and recovered can be seen to take a drastic change, with more number of people being recovered over the coming days.
2. Degree Based Strategy
In this strategy, we take help from the contact network graph in identifying the nodes(people) with the highest number of contacts which is indicated by the highest number of distinct edges arising from a node, i.e. the nodes with the maximum degree. To implement this strategy, first the degrees of all the nodes are recorded for the first few days. Based on this collected data, the list of these nodes is then sorted in decreasing order of their degrees. Then the first k nodes from this sorted list are selected for vaccination where k is the given percentage of people out of the total population. This strategy evidently works better than the first one as here we are selectively choosing a better group of people, vaccinating whom can have a larger impact on the overall outbreak. Hence the graphs can be seen to show better recovery and lesser death than the first strategy.
3. Metadata based strategy
In datasets, data indicates the entities and their prime features on which the models will be trained. Metadata is additional data describing each entity. In a special dataset we considered, metadata included the daily routines of the people. Some routines make it inevitable for people to have frequent contact with other people. For instance, a person from a family who has to go to office everyday is more likely to be in contact with a lot more people than the other members of the family. This way we can get a fair idea of the people we might have to vaccinate in order to have the best impact on the community. In our strategy, as mentioned earlier, we have selected k random people among the group of persons who have a very social lifestyle. (Eg : daily jobs – office).
Future Ventures
As of now we have seen models which vaccinate people only based on available data, like the number of nodes with maximum degree out of whatever nodes have been introduced into the network till that given point of time, say time t(Eg: t = 5 days). Coming up with such vaccination strategies might not give us the best results as we don’t know the rest of the contact network after time t. But what if there was a way to predict the best vaccination strategy (or close to the best one) by speculating the pattern of the entire contact network and vaccinating the right nodes based on this speculation. This brings us into the world of machine learning. In the future we are planning on using GNNs(Graph Neural Network) to identify the pattern of a given graph and vaccinate the best people possible. For this, we will have to train our model using several contact network training models(datasets), using either of the following two metrics:
- Number of deaths in the model can be predicted and hence the right people can be vaccinated
- The people being vaccinated can be another metric we can use to train our model but this implementation might be a lot harder than the first one.
Conclusion
As we all know a disease outbreak can become a catastrophe, with a lot of lives at stake and a lot more subdued. This project has been brought out with a vision that can help alleviate such globally magnified problems. Yes, there is an option to vaccinate all people to be on the safer side and have absolute surety of global recovery. But this approach, if thought upon seems very naive, time consuming, highly uneconomical and tiring. Rather, if there was a method to smartly vaccinate people in a community and still guarantee the same results, we would be stepping into a new generation of disease outbreak management. This project is that stepping stone.