Project Guide
- Dr. Krishnan CMC
Mentors
- Shreyas Rao
- Garvin Pokhra
Members
- Palgun NP
- Pranav Koundinya
Aim
The goal of this project is to research and implement classification and segmentation techniques to diagnose brain diseases like Alzheimer’s disease and brain tumors.
Alzheimer’s disease classification
Alzheimer’s disease (AD) is a progressive and incurable neurodegenerative disease which destroys brain cells and causes loss to a patient’s memory. An early detection can prevent the patient from further damage of the brain cells and hence avoid permanent memory loss. CNNs can directly accept images data as input, utilize spatial information embedded in adjacent pixels, and effectively reduce the number of model parameters by using weights sharing and subsampling. In this report, we demonstrate the use of 4 deep learning architectures for Alzheimer’s disease classification.
DenseNet
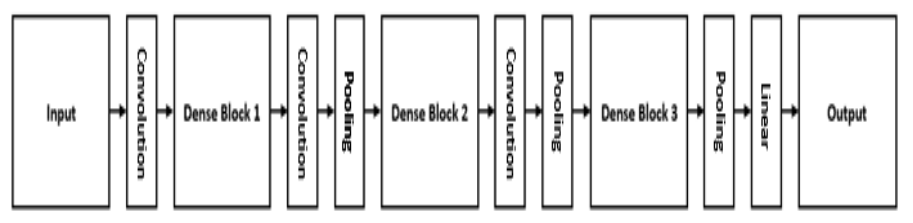
The DenseNet CNN network has an architecture different from most of the state-of-the-art CNN networks. The input to the network, is first passed through a convolution layer. Each convolution layer in the model is preceded by batch normalization and a ReLU activation layer. The Densenet network is made up multiple dense block and transition layers. A dense block is a block of multi-layer convolutional layer with interconnected input.
MobileNet
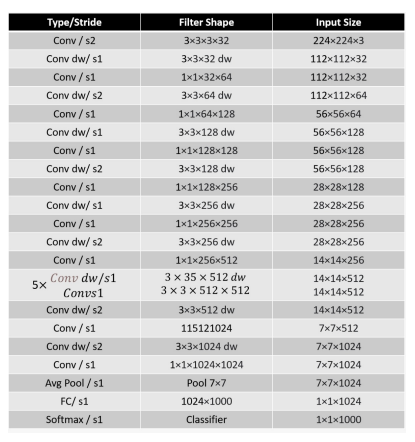
MobileNet architecture is a state-of-the-art lightweight CNN network used for mobile and embedded vision applications. The network is specially designed to reduce the computational memory, space and hardware to train neural networks. The network uses depthwise separable convolution along with the standard convolution to reduce the computational cost.
All the convolution layers in the network except the first layer are depthwise convolution layers. Each standard convolution layer has a 3 × 3 convolutional filter followed by batch normalization and ReLU non-linear activation, whereas each depthwise convolutional layer have a 3 × 3 depthwise convolutional layer followed by batch normalization and ReLU nonlinear activation which is again followed by 1 × 1 convolutional layer, batch normalization and another ReLU non-linear activation.
ResNet-50
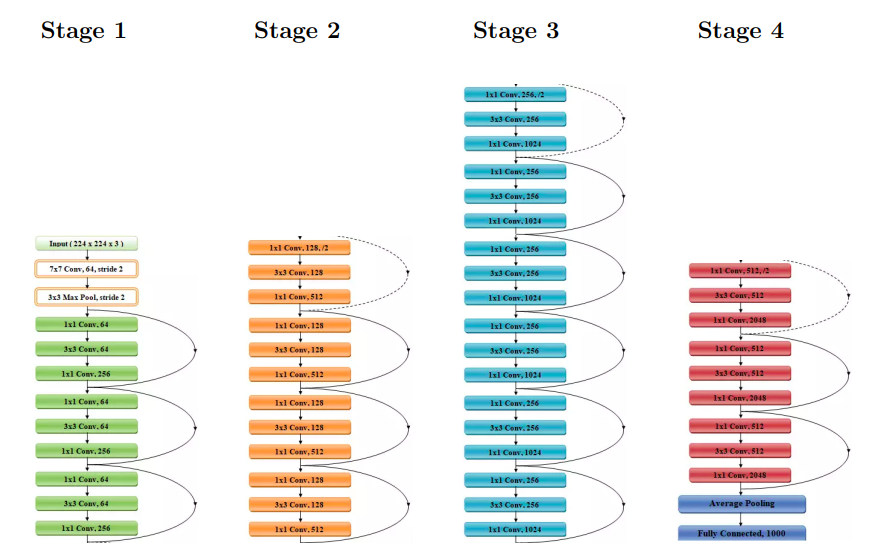
The architecture of ResNet50 has 4 stages. Every ResNet architecture performs the initial convolution and max-pooling using 7×7 and 3×3 kernel sizes respectively, after which Stage 1 of the network begins which has 3 Residual blocks containing 3 layers each.
As we progress from one stage to another, the channel width is doubled and the size of the input is reduced to half. For each residual function F, 3 layers are stacked one over the other. The three layers are 1×1, 3×3, 1×1 convolutions. The 1×1 convolution layers are responsible for reducing and then restoring the dimensions. The 3×3 layer is left as a bottleneck with smaller input/output dimensions. Finally, the network has an Average Pooling layer followed by a fully connected layer having 1000 neurons.
Inception v3
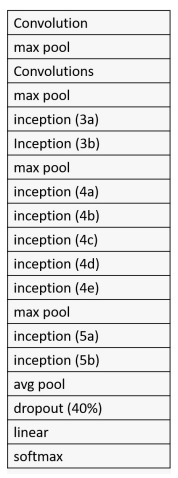
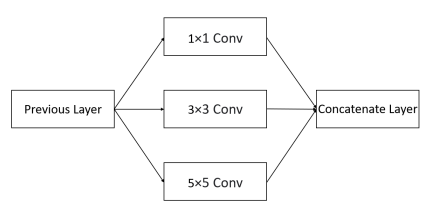
This is a network which is 27 layers deep. Inception Layer is a combination of three layers namely, 1×1 Convolutional layer, 3×3 Convolutional layer, 5×5 Convolutional layer, with their outputs concatenated into a single output vector forming the input of the next stage. It allows the internal layers to pick and choose which filter size will be relevant to learn the required information. So even if the size of the object in the image is different, the layer works accordingly to recognize the object.
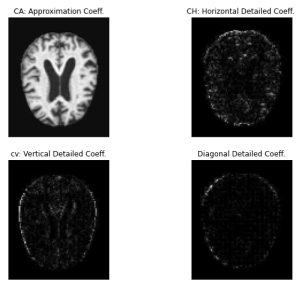
Wavelet transform
In signal processing, the wavelet transform is used as a feature extraction technique. It decomposes a signal into various frequency components with different resolutions. The signal is decomposed by convolving it with a wavelet of varying width and position. A Wavelet is a wave-like oscillation that integrates to zero and is localized in time. These are fed into the CNNs as feature frames
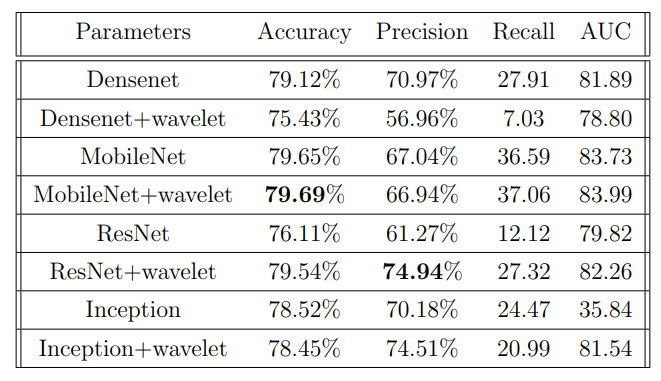
Results
Brain tumor Segmentation
Brain tumors include the most threatening types of tumors around the world. Glioma, the most common primary brain tumors, occurs due to the carcinogenesis of glial cells in the spinal cord and brain. Glioma is characterized by several histological and malignancy grades, and an average survival time of fewer than 14 months after diagnosis for glioblastoma patients1. Magnetic Resonance Imaging (MRI), a popular non-invasive strategy, produces a large and diverse number of tissue contrasts in each imaging modality and has been widely used by medical specialists to diagnose brain tumors2. However, the manual segmentation and analysis of structural MRI images of brain tumors is an arduous and time-consuming task which, thus far, can only be accomplished by professional neuroradiologists3,4. Therefore, an automatic and robust brain tumor segmentation will have a significant impact on brain tumor diagnosis and treatment.
U-Net
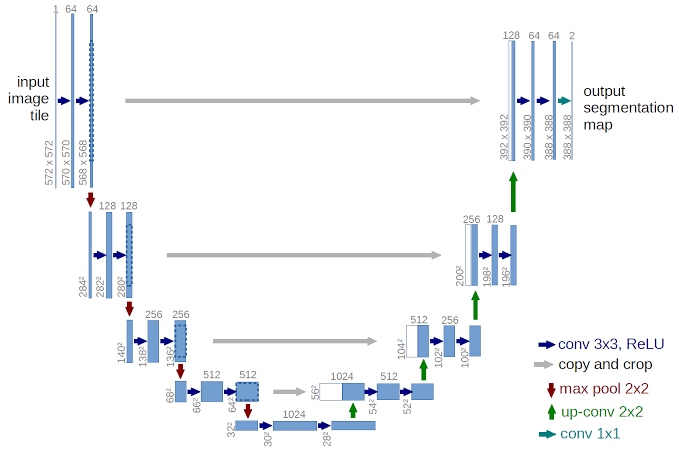 First sight, it has a “U” shape. The architecture is symmetric and consists of two major parts — the left part is called contracting path, which is constituted by the general convolutional process; the right part is expansive path, which is constituted by transposed 2d convolutional layers.
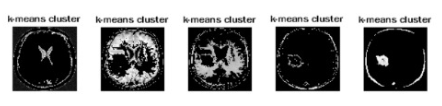
K-means clustering
The working of the K-Means algorithm is explained in the below steps:
Step-1: Select the number K to decide the number of clusters.
Step-2: Select random K points or centroids. (It can be other from the input dataset).
Step-3: Assign each data point to their closest centroid, which will form the predefined K clusters.
Step-4: Calculate the variance and place a new centroid of each cluster.
Step-5: Repeat the third steps, which means reassign each datapoint to the new closest centroid of each cluster.
Step-6: If any reassignment occurs, then go to step-4 else go to FINISH.
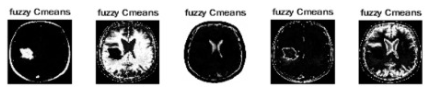
Fuzzy C-means clustering
Steps involved are as follows:
Step 1: Initialize the data points into the desired number of clusters
Step 2: Compute the centroid
Step 3: Find out the distance of each point from the centroid
Step 4: Update membership values
Step 5: Repeat steps 2-4 until constant values are obtained
Step 6: Defuzzify the obtained values
Conclusion
In this project, we have explored image processing and machine learning techniques to diagnose brain diseases. We started off with an Alzheimer’s disease classifier for which we trained four different CNN models. We then incorporated the wavelet transform into the same. Next, we trained the infamous U-Net model for tumor segmentation and also explored clustering algorithms like k-means and fuzzy C-means clustering for the same. We hope it was interesting!